[ad_1]
For a given Axis you can set the LabelStyle.Format.
For example you can use this :
chart1.ChartAreas["area1"].AxisX.LabelStyle.Format = "000.000\\%";
or this:
chart1.ChartAreas[0].AxisY.LabelStyle.Format = "###,##0.00000";
Note: This formats the Label of the Axis Grid, hence what you perceive as rounding. In fact it is the value for the GridLines not the Values of the DataPoints!
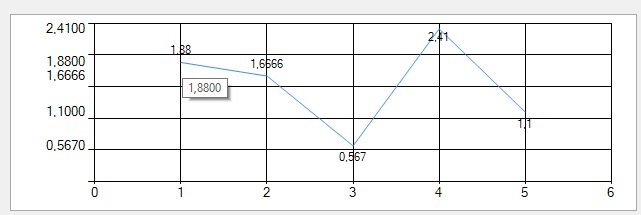
To display the Y-Values of the DataPoints you have three options I know of and I’ll show you each:
You can display them inside the graph with each point
You can display them as tooltips when the mouse is over a point
or you can display them in
CustomLabelsalong the Y-Axis, which may be what you want. Please note that this will only be a useful option if
- There is a very limited number of data points
- Those points are spread out reasonably far apart
If one or both conditions are not met, the CustomLabels will overlap.
Setting CustomLabels is somewhat tricky. Here is a piece of code that sets one per each data point. As noted you may need to insert checks to prevent the overlapping..
// propare a few short names
ChartArea CA = chart1.ChartAreas[0];
Series S1 = chart1.Series[0];

// this would be option one:
S1.IsValueShownAsLabel = true;

// we clear any previous CustomLabels
CA.AxisY.CustomLabels.Clear();
// we create a version of our points collection which sorted  by Y-Values:
List<DataPoint> ptS = S1.Points.OrderBy(x => x.YValues[0]).ToList();

// now, for option three we add the custom labels:
for (int p = 0; p < ptS.Count; p++)
{
    CustomLabel L = new CustomLabel(ptS[p].YValues[0] - 0.5,
                                    ptS[p].YValues[0] + 0.5,
                                    ptS[p].YValues[0].ToString("##0.0000"),
                                    0, LabelMarkStyle.None);
    CA.AxisY.CustomLabels.Add(L);

    // this is option two: tooltips for each point
    ptS[p].ToolTip = ptS[p].YValues[0].ToString("##0.0000");
}
The first two parameters of a CustomLabel are about the Y-position or actually the Y-Value range they are supposed to label. Next the value, formatted to show the decimal digits you wanted. Finally first row of labels and no tickmarks.
Here is a screenshot that shows all three options at work:
3
[ad_2]
solved Display Y-Values on Y-Axis without rounding [closed]