[ad_1]
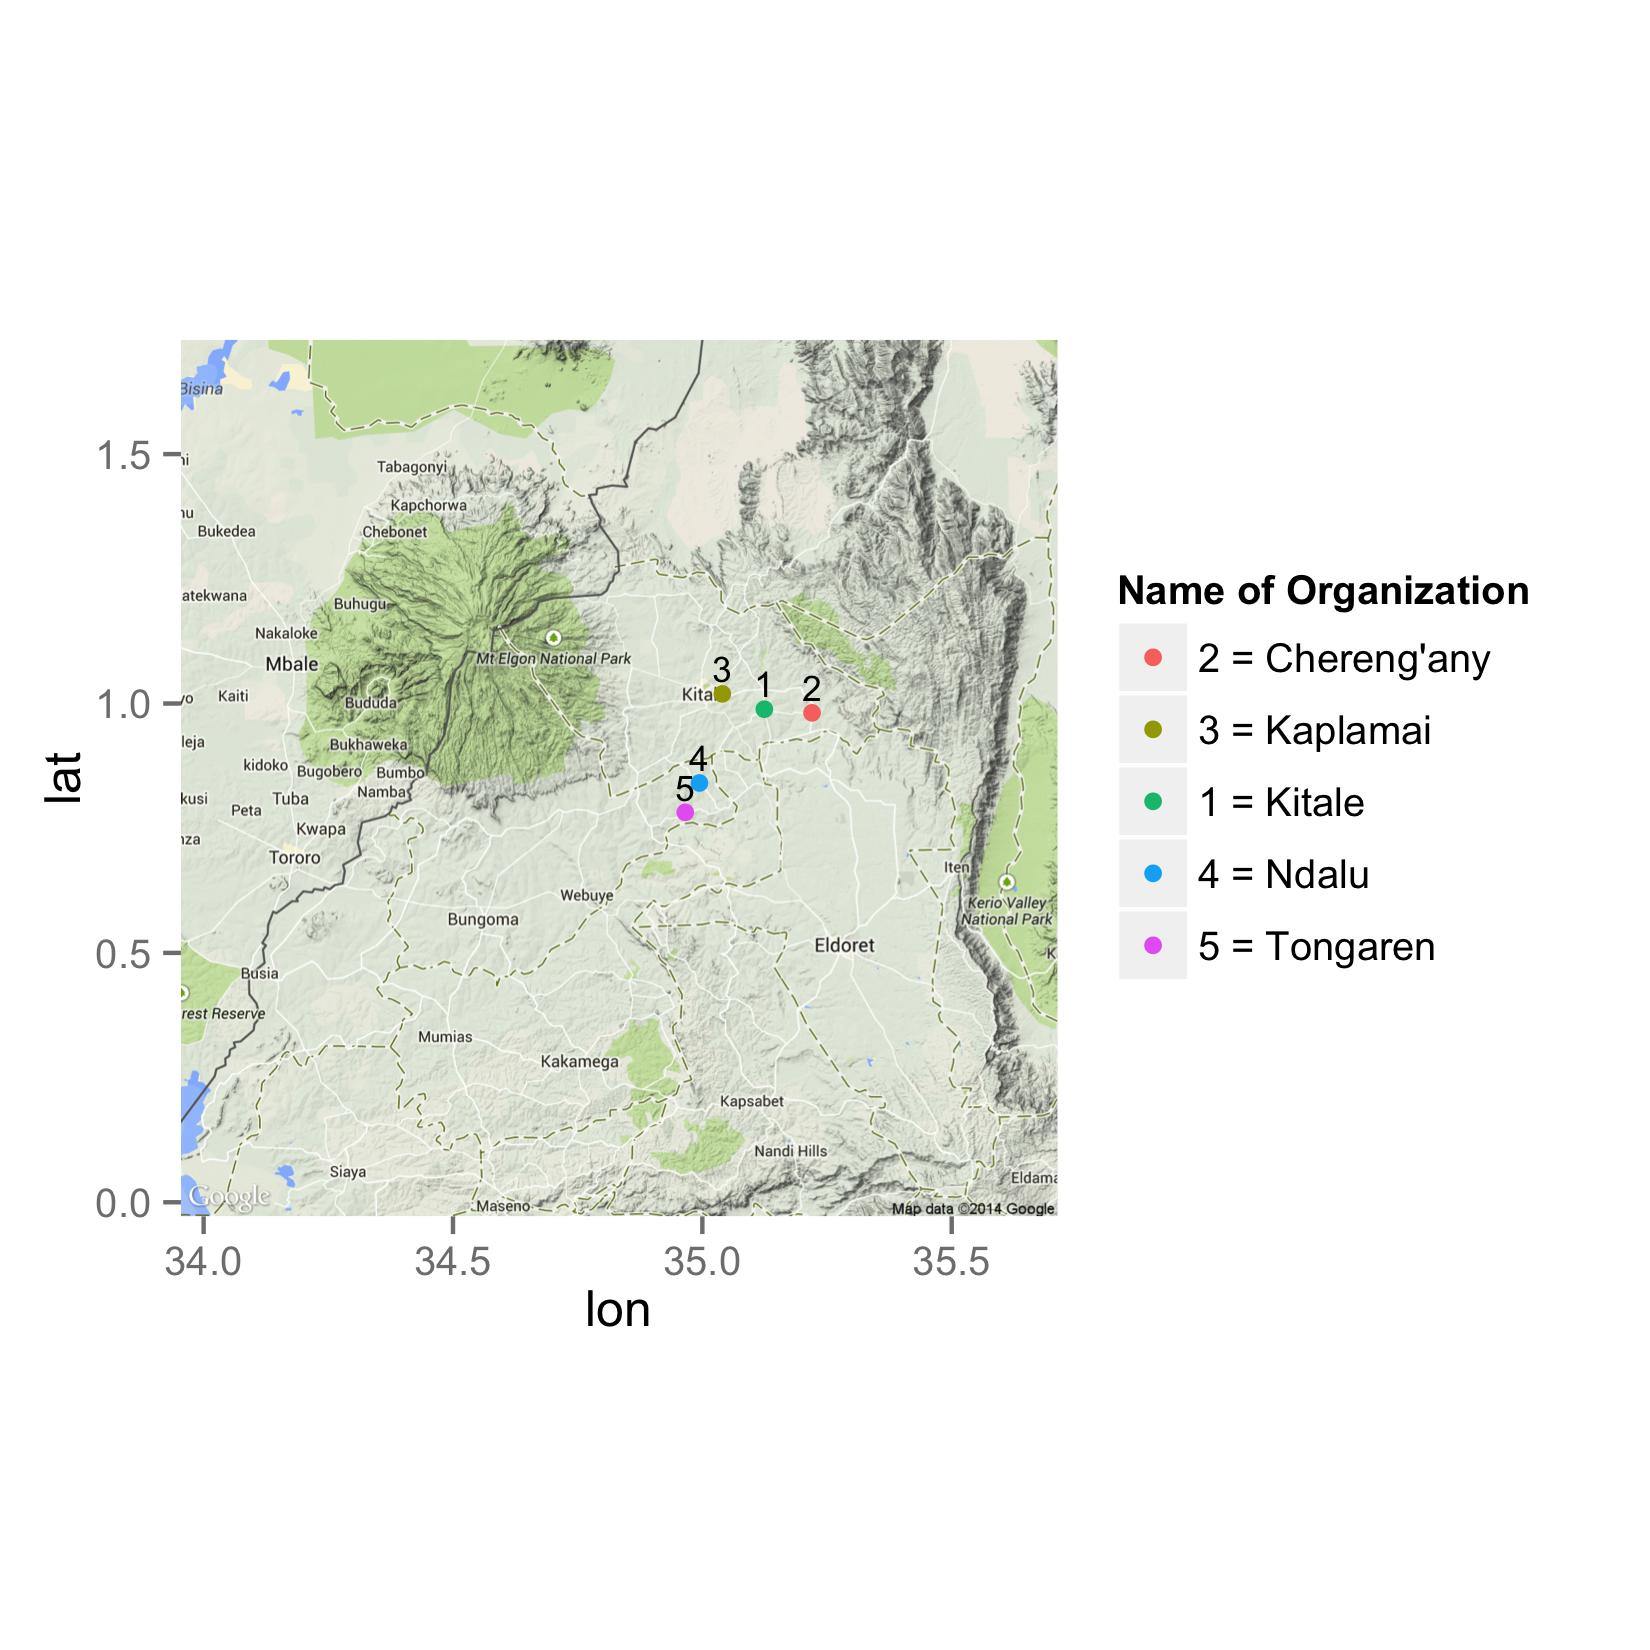
Here is one approach. I created new lat for text annotation using transform in base R. I used geom_text to add the labels you wanted. I used scale_colour_discrete to change the name of the legend.
library(ggmap)
library(ggplot2)

### Get a map
map <- get_map(location=c(lon=34.832, lat=0.852), color="color",
               source="google", maptype="terrain", zoom=9)

### Create new lat for annotation position
mydf2 <- transform(mydf,lat2 = lat + 0.05)


ggmap(map) +
geom_point(data = mydf2, aes(x = long, y = lat, color = Name_of_Organization)) +
geom_text(data = mydf2, aes(x = long, y = lat2, label = ORGANIZATION_ID), size = 3) +
scale_colour_discrete(name  = "Name of Organization")

DATA
mydf <- structure(list(ORGANIZATION_ID = 1:5, lat = c(0.988597, 0.981345,
1.019304, 0.840672, 0.78183), long = c(35.124259, 35.219947,
35.040037, 34.994145, 34.965753), Name_of_Organization = structure(c(3L,
1L, 2L, 4L, 5L), .Label = c("2 = Chereng'any", "3 = Kaplamai", "1 = Kitale",
"4 = Ndalu", "5 = Tongaren"), class = "factor")), .Names = c("ORGANIZATION_ID",
"lat", "long", "Name_of_Organization"), class = "data.frame", row.names = c(NA,
-5L))

#  ORGANIZATION_ID      lat     long Name_of_Organization
#1               1 0.988597 35.12426           1 = Kitale
#2               2 0.981345 35.21995      2 = Chereng'any
#3               3 1.019304 35.04004         3 = Kaplamai
#4               4 0.840672 34.99415            4 = Ndalu
#5               5 0.781830 34.96575         5 = Tongaren
2
[ad_2]
solved ploting ggmap with geom Points (lat_long) annotated 1 to19. Points data is in CSVfile